One page, rebuilt around one argument: run the same site twice and read the difference. The data under it is real measured Hong Kong simulation output.
?icp=…).Fast metre‑resolution simulation for wind
01 · What it is
We simulate the climate around and inside buildings — wind, heat, sun and daylight — at metre resolution, in seconds. One site below. Pick a scale, pick an analysis: every number is read off the model, nothing is a picture of one.
How much daylight actually reaches a desk on this floor, once the neighbours block the sky. Resolved floor by floor.
02 · Buy the layer
Everyone else ships an application. We ship the capability — so a product, a practice or a city becomes climate-aware without hiring a simulation team.
COST: A DEPARTMENT, AND YEARS
One call. A field back in seconds — tiling, polling and merging handled for you. You get a result, not a job queue to babysit.
# pip install infrared-sdk from infrared_sdk import Client client = Client(api_key) run = client.run_area( polygon=aoi, analysis="thermal-comfort") heat = run.result() # → a field, in seconds
COST: ONE CALL, UNDER 10 S FOR A SMALL SITE
Also inside the tools already open on your desk: Grasshopper (Rhino 8) · Revit · QGIS · ArcGIS · agent skills. SketchUp is coming.
03 · Four ways in
Pick the one that sounds like your week.
Put climate physics inside your platform without owning the physics.
API & SDK → 02See where heat is dangerous today, and where the budget should go.
Live layer → 03Submission-ready analysis in an afternoon, not a fortnight.
Workflows → 04Test options while they can still change, inside the tools you use.
Platform & plugins →Not sure? The free tier runs the same engine →
04 · Proof
Same site, same engine, two wind directions. Drag the divide: each side is a real run, and the number on the line is the measured difference between them.
LOADING MEASURED WIND RUNS…
| Model | Measured against | Status |
|---|---|---|
| Thermal comfort | 2–4 K RMSE on temperate built-up scenes, no per-site calibration | Validated |
| Wind | Benchmarked against AIJ wind-tunnel measurements | Screening |
| Daylight sky model | Byte-for-byte identical to the Radiance reference | Exact |
| Per-model studies | Underway; a consolidated overview is in preparation | In progress |
Tiles run in parallel — a district costs barely more time than a single site. Timings are typical and vary with connection.
Screening-grade. Good enough to compare options and find problems — not a certified measurement. We say so because it is what makes the rest trustworthy.
05 · Live
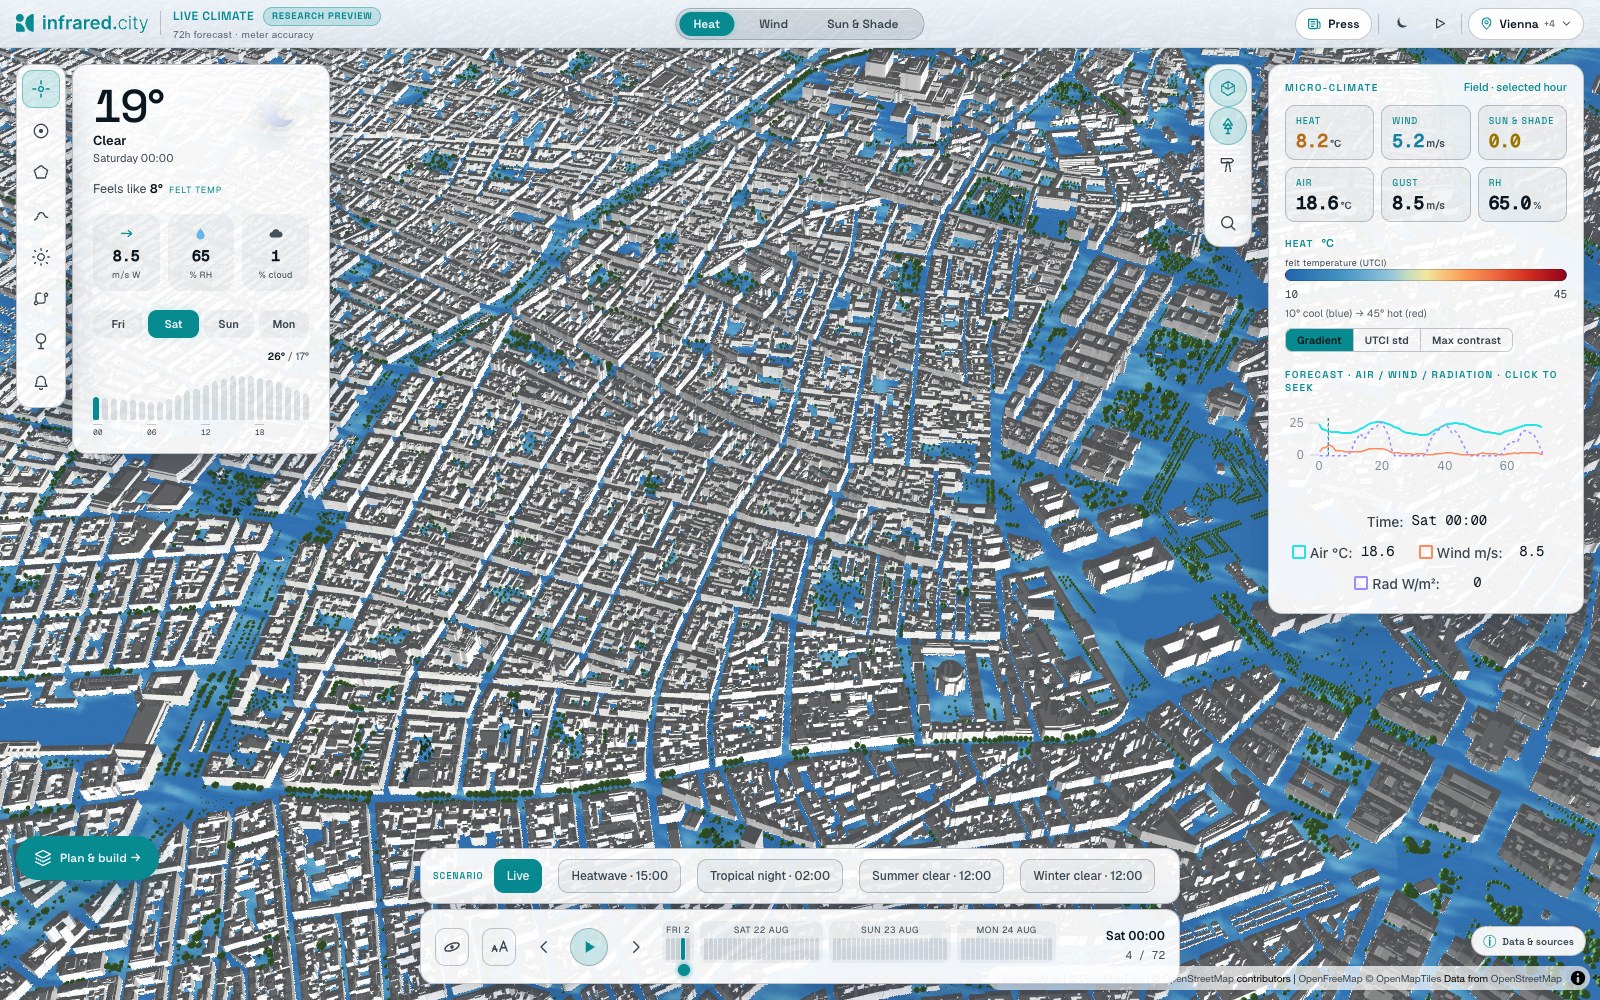
The layer answers street by street, 72 hours ahead — and with the what-if engine you plant trees and watch the answer change.
Vienna · 160 km² · 1 m · 72 h
06 · Pricing
One token currency across platform, plugins and API · start without a credit card · paid plans billed annually
€0
Students & small studies
€240/yr
Small sites
MOST USED
€1,200/yr
Quarter scale
€6,000/yr
District to city
Top-up packs at each plan’s own discount — list rate €0.10 per token · one analysis = 10 tokens · pay only for the area you study. Pro pricing is under review.
Custom digital twin · live layer for your city · co-development